


Turbidity Monitoring in Bottled Water Production
Turbidity monitoring in bottled water production is a critical quality control indicator. This application note explores turbidity principles and demonstrates how the LAQUA TB220 turbidity meter offers a reliable, high-precision solution for measurements.
All About Water
The global bottled water market was valued at approximately USD 352 billion in 2024 and is projected to reach approximately USD 675 billion by 20331.
Bottled water is an important source of drinking water in regions where access to reliable, safely managed tap water is limited2.
Bottled water consumption continues to rise due to increasing health consciousness, perceived product purity, and the convenience of on-the-go hydration3.
Providing safe water in water-stressed regions faces severe technological challenges such as high energy costs and maintenance barriers.
The urgency of these issues is underscored by the staggering reality that consumers globally purchase more than one million plastic water bottles every single minute4.
Bottled Water Production
Bottled water production is a multi-stage process where turbidity acts as a key indicator of treatment effectiveness and water quality5.
Although the treatment configuration depends on the source water and finished-product requirements, bottled water production generally applies a multi-barrier approach that may include the following stages:
- Collection and initial screening through multimedia filters
- Reduction of taste, odor, organic compounds, and fine particles through activated carbon and appropriate filtration
- Deep purification via high-pressure systems like reverse osmosis or ultrafiltration
- Sterilization with UV light or ozone gas to disinfect the water and neutralize bacteria
- Packaging and sealing in a sterile environment
Depending on the treatment process, turbidity monitoring in bottled water production can occur at several points, including the raw-water intake, after filtration, before membrane treatment, and before final filling. Bottled water producers typically monitor final stage quality to meet strict clarity standards, ensuring the product stays well below the industry benchmark of 0.5 NTU and this limit adheres directly to the IBWA Bottled Water Code of Practice6.

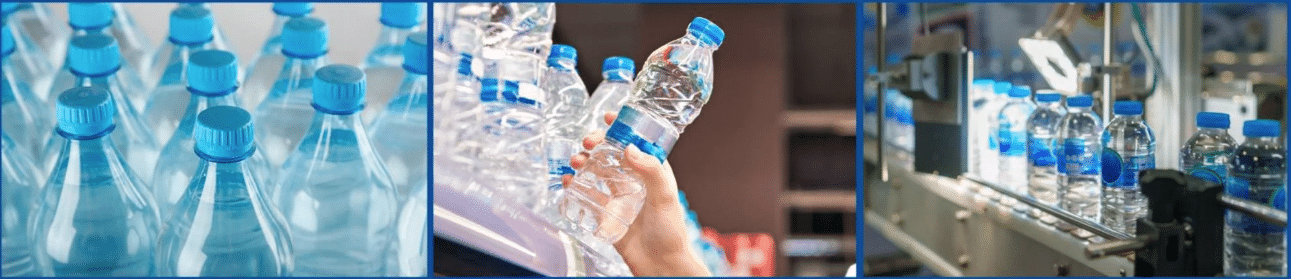
Figure 1: Bottled water production
Maintaining low turbidity supports effective treatment, improves the visual clarity of the finished product, and helps reduce the potential for suspended particles to interfere with disinfection. The applicable limit or target should be determined according to local regulations and the facility’s quality-control plan.
Understanding Turbidity
Turbidity refers to the clarity or cloudiness of water. When particles are suspended in the water, they scatter light rays rather than letting them pass directly through, giving the water a hazy appearance.

Figure 2: Turbidity reference7
Common causes of turbidity: Turbidity may result from suspended silt, clay, organic matter, algae, microorganisms, and other fine particulate material.
In general, an increase in suspended-particle concentration results in higher turbidity; however, the reading can also be influenced by particle size, shape, color, and optical properties.
The LAQUA TB220 turbidity meter offers professional-grade optical sensing up to 2000 NTU for laboratory and field use. The TB220 is built to comply with ISO 7027 and DIN EN 27027 protocols. It also utilizes a ratiometric measurement principle to deliver rapid, consistent data.
The Ratiometric Edge
- Reduced interference: The ratiometric measurement principle uses scattered-light and transmitted-light signals to help minimize the influence of sample color and other optical variations.
- Versatile Range: Features auto-ranging capabilities to provide dependable data across a wide spectrum.
Measurement Procedure

Figure 3: TB220, Waterproof turbidity portable meter with backlit LCD and shockproof, scratch-resistant, non-slip casing.
The LAQUA TB220 turbidity meter features an intuitive, 4-step process for lab-grade results:
- Calibration: Supports up to four points using high-stability SDVB polymer standards (0.02, 20, 100 and 800 NTU).
- Sample Preparation: Pour the sample into a clean, fingerprint- and bubble-free glass vial.
- Analysis: Insert the vial and close the lid. A backlit display facilitates viewing, while the built-in smiley indicator ☺ shows when the reading has stabilized.
- Data Management: Stores up to 2,000 measurements with date and time stamps. Data can be transferred to a PC using DAS20 software and the dedicated PC USB cable or printed using the dedicated printer RS232 cable.
Best Practices for Accuracy
- Vial Care: Use clean, unscratched vials and apply a thin layer of silicone oil to mask microscopic scratches.
- Degassing and Homogeneity: Dissipate air bubbles and gently invert samples to suspend particles uniformly.
- Promptness: Measure immediately after collection to prevent settling or chemical degradation.
Conclusion
The LAQUA TB220 turbidity meter combines ISO 7027-compliant measurement performance, field-ready durability, and laboratory-grade precision, making it a dependable solution for turbidity monitoring in bottled water production.
Contact us for a demonstration or visit HORIBA Water Quality website to download the full technical specifications.
Contact us for more information or visit HORIBA Water Quality website to download the full technical specifications.
Click here to download the full Application Note PDF.
References and Suggested Readings
| 1 | Yahoo Finance. (2023, March 23). Bottled water market size worth $510.15 billion by 2030: Grand View Research, Inc.https://finance.yahoo.com/news/bottled-water-market-size-worth-010000167.html |
| 2 | The Straits Times. (2023, March 22). 1 in 4 people lack access to safe drinking water: UN. https://www.straitstimes.com/world/europe/1-in-4-people-lack-access-to-safe-drinking-water-un |
| 3 | Fortune Business Insights. (2023, June). Bottled water processing market size, share and COVID-19 impact analysis, by technology (ion exchange, distillation, reverse osmosis, ultrafiltration, microfiltration, chlorination, and others), by application (still water and sparkling water), and regional forecast, 2022-2029.https://www.fortunebusinessinsights.com/bottled-water-processing-market-104069 |
| 4 | United Nations University. (2023, March 16). Bottled water masks world’s failure to supply safe water for all [Press release]. https://unu.edu/press-release/bottled-water-masks-worlds-failure-supply-safe-water-all |
| 5 | New Haiguang. (n.d.). Bottled water production processes. https://newhaiguang.com/bottled-water-production-processes/ |
| 6 | International Bottled Water Association. (2015). Bottled Water Code of Practice (Rev. Feb. 2015). https://bottledwater.org/wp-content/uploads/2020/04/IBWA-MODEL-CODE-2015-Rev-02-2015.pdf |
| 7 | Retrieved from https://www.savemyexams.com/as/environmental-management/cie/20/revision-notes/2-environmental-research-and-data-collection/2-4-data-collection-techniques-and-data-analysis/2-4-1-data-collection-techniques/ |
Revision 0, 12 October 2026
